간단한 예제 실행하기
원본 URL: https://docs.bullmq.io/guide/telemetry/running-a-simple-example
간단한 예제 실행하기
섹션 제목: “간단한 예제 실행하기”프로듀서 만들기
섹션 제목: “프로듀서 만들기”이 간단한 예제에서는 프로듀서를 만들어 몇 개의 작업을 추가해 보겠습니다. 다만 작업을 하나씩이 아니라 bulk로 추가할 것이며, 이를 통해 컨슈머와 프로듀서 사이에서 span이 어떻게 연결되는지 보여줄 수 있습니다:
{% code title=“producer.ts” %}
import { Queue } from "bullmq";import { BullMQOtel } from "bullmq-otel";
const queue = new Queue("myQueue", {  connection: {    host: "127.0.0.1",    port: 6379,  },  telemetry: new BullMQOtel("simple-guide"),});
const jobsBulk = Array.from({ length: 5 }, (_, i) => i);
(async () => {  for (let i = 0; i < 10; i++) {    await queue.addBulk(      jobsBulk.map((j) => ({        name: `myJob ${j}`,        data: { i: j },        opts: { attempts: 2, backoff: 1000 },      }))    );  }})();
{% endcode %}
컨슈머 만들기
섹션 제목: “컨슈머 만들기”컨슈머는 단순한 인스턴스로 구성합니다. concurrency를 10으로 설정해 작업이 동시에 처리되도록 하고, 그 결과 span이 겹쳐서 생성되게 합니다. 또한 작업 실패를 시뮬레이션해 재시도가 발생하도록 하여, 작업이 실패하고 재시도된 뒤 최종 완료될 때 span이 어떻게 생성되는지 보여주겠습니다:
{% code title=“consumer.ts” %}
import { Worker } from "bullmq";import { BullMQOtel } from "bullmq-otel";
(async () => {  const worker = new Worker(    "myQueue",    async (job) => {      console.log("processing job", job.id, job.attemptsMade);      await new Promise(async (res) => {        setTimeout(() => res({}), 200);      });
      if (job.attemptsMade < 1) {        throw new Error("This was an error");      }
      return "my result value";    },    {      name: "myWorker",      connection: {        host: "127.0.0.1",        port: 6379,      },      telemetry: new BullMQOtel("simple-guide"),      concurrency: 10,    }  );})();
{% endcode %}
계측 파일 만들기
섹션 제목: “계측 파일 만들기”telemetry 기능을 테스트하기 위해 간단한 예제를 실행할 수 있습니다. 이를 위해 OpenTelemetry Protocol (OTLP) exporter를 사용해 OpenTelemetry SDK도 함께 초기화해야 합니다.
OpenTelemetry SDK에 포함된 다음 모듈들을 설치해야 합니다:
npm install @opentelemetry/exporter-trace-otlp-proto \ @opentelemetry/exporter-metrics-otlp-proto이제 소위 “instrumentation” 파일을 만들어야 합니다. 실제로 작업 생성을 담당하는 “producer” 서비스용 파일을 하나 만들 것이고, 아래와 같은 형태입니다. Jaeger 서비스가 실행 중인 localhost (127.0.0.1)를 사용한다는 점에 유의하세요:
{% code title=“producer.inst.otlp.ts” %}
import { NodeSDK } from '@opentelemetry/sdk-node';import { OTLPTraceExporter } from '@opentelemetry/exporter-trace-otlp-proto';import { OTLPMetricExporter } from '@opentelemetry/exporter-metrics-otlp-proto';import { PeriodicExportingMetricReader } from '@opentelemetry/sdk-metrics';
const sdk = new NodeSDK({  serviceName: 'producer',  traceExporter: new OTLPTraceExporter({    url: 'http://127.0.0.1:4318/v1/traces'  }),  metricReader: new PeriodicExportingMetricReader({    exporter: new OTLPMetricExporter({      url: 'http://127.0.0.1:4318/v1/metrics'    }),  }),});
sdk.start();
{% endcode %}
마찬가지로 “consumer” 서비스용 instrumentation 파일도 하나 더 만듭니다. 이 서비스에서 worker가 실행되어 “Queue” 인스턴스가 생성한 작업을 소비하게 됩니다:
{% code title=“consumer.inst.otlp.ts” %}
import { NodeSDK } from '@opentelemetry/sdk-node';import { OTLPTraceExporter } from '@opentelemetry/exporter-trace-otlp-proto';import { OTLPMetricExporter } from '@opentelemetry/exporter-metrics-otlp-proto';import { PeriodicExportingMetricReader } from '@opentelemetry/sdk-metrics';
const sdk = new NodeSDK({  serviceName: 'consumer',  traceExporter: new OTLPTraceExporter({    url: 'http://127.0.0.1:4318/v1/traces'  }),  metricReader: new PeriodicExportingMetricReader({    exporter: new OTLPMetricExporter({      url: 'http://127.0.0.1:4318/v1/metrics'    }),  }),});
sdk.start();
{% endcode %}
두 서비스는 기본적으로 거의 동일하며, 이 경우 서비스 이름만 다릅니다.
서비스 실행하기
섹션 제목: “서비스 실행하기”OpenTelemetry 계측이 다른 모든 것보다 먼저 실행되고 필요한 내부 패치를 수행하도록 보장하려면(BullMQ 자체는 패치에 의존하지 않더라도 다른 모듈은 그럴 수 있음), 다음과 같이 실행해야 합니다(이 예제에서는 tsx를 사용하지만 Node 런타임을 사용해도 됩니다:
tsx --import producer.inst.otlp.ts producer.tstsx --import consumer.inst.otlp.ts consumer.ts{% hint style=“info” %}
javascript를 사용 중이거나(또는 Typescript를 javascript로 빌드하는 경우) Node 런타임을 직접 사용할 수도 있습니다: node --import producer.inst.otlp.js producer.js
{% endhint %}
서비스를 실행하면 컨슈머가 작업 처리를 시작하고 콘솔에 일부 로그를 출력하는 것을 볼 수 있습니다:
> tsx --import consumer.inst.otlp.ts consumer.ts
processing job 1 0processing job 2 0processing job 3 0processing job 4 0processing job 5 0processing job 6 0...processing job 43 1processing job 44 1processing job 45 1processing job 46 1processing job 47 1processing job 48 1processing job 49 1processing job 50 1
이 로그들은 worker의 “process” 함수에서 우리가 직접 작성한 로그일 뿐이므로, 여기서는 특별한 내용이 없습니다. 하지만 Jaeger로 가보면 다음을 확인할 수 있습니다:
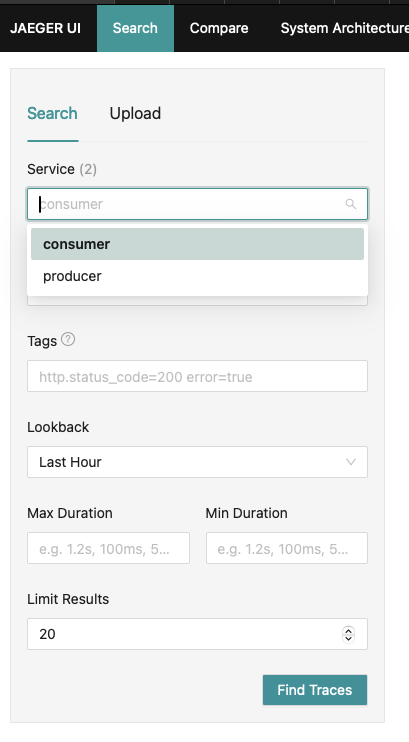
이제 선택 가능한 서비스가 2개(consumer, producer) 생겼습니다. producer에서 trace를 검색하면 producer가 관여한 모든 trace를 볼 수 있습니다:
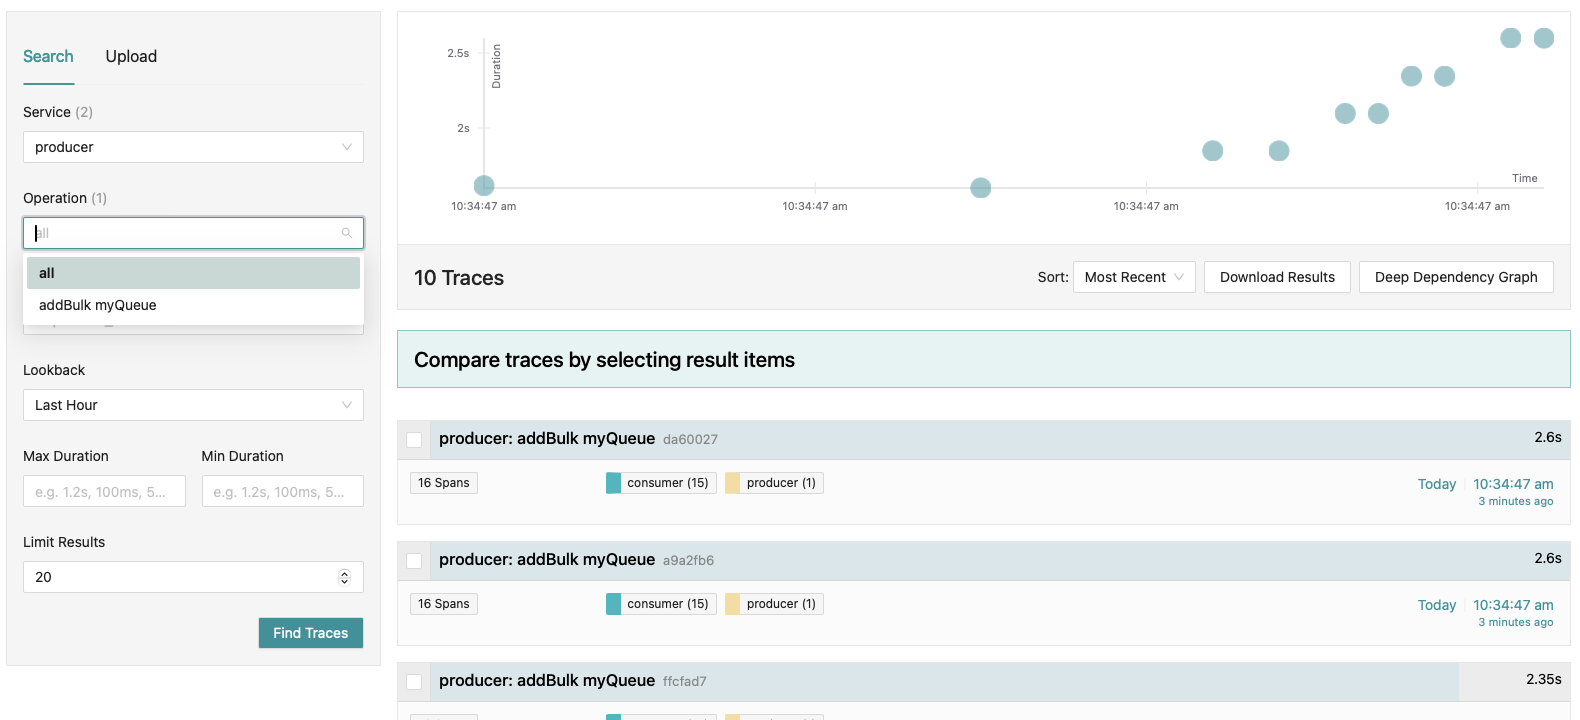
여기서 producer trace를 검색했음에도 consumer span도 함께 보인다는 점을 확인할 수 있습니다. 이는 작업이 producer와 consumer 사이에서 연결되기 때문이며, 작업 생성부터 최종 처리까지 전체 흐름을 추적할 수 있게 해줍니다.
예를 들어 consumer span을 보면 흥미로운 점들이 있습니다:
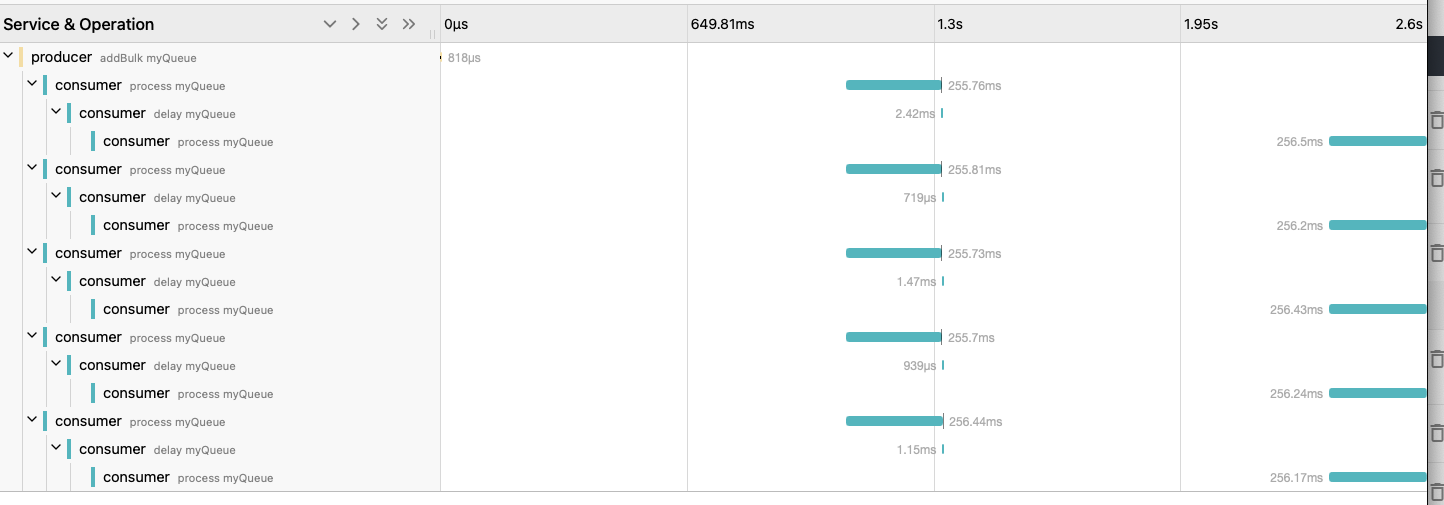
먼저 producer span인 “addBulk myQueue”가 이 trace의 루트라는 점을 보세요. 이것은 addBulk이므로 여러 작업이 한 번에 큐에 추가되었다는 뜻이며, 이 예제에서는 5개입니다. 따라서 consumer가 생성한 span들은 이 하나의 producer span에 연결됩니다. “process myQueue” consumer span은 처리되는 각 작업마다 생성되고, concurrency 값이 5보다 크기 때문에 5개 작업 모두 동시에 처리됩니다. span들이 모두 같은 시점에 시작되는 것으로 이를 확인할 수 있습니다.
또한 작업이 1번 실패하도록 강제했기 때문에, 짧은 backoff (delay) 후 재시도됩니다. 그래서 “delay myQueue” span이 보이고, 그다음 최종 “process myQueue” span이 보입니다.
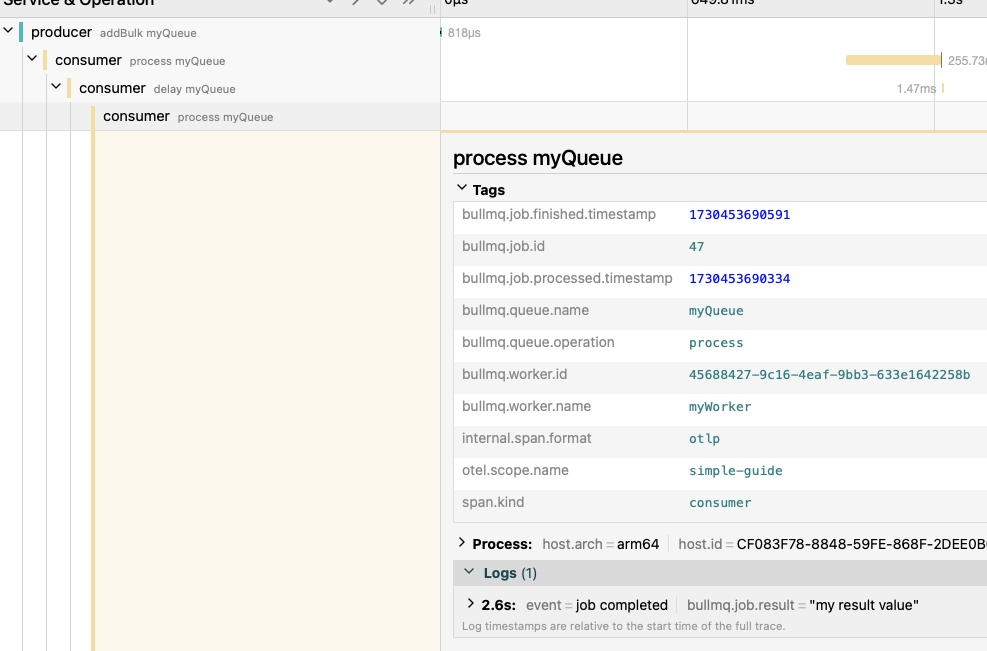
span을 열어보면 다른 유용한 정보도 확인할 수 있습니다:
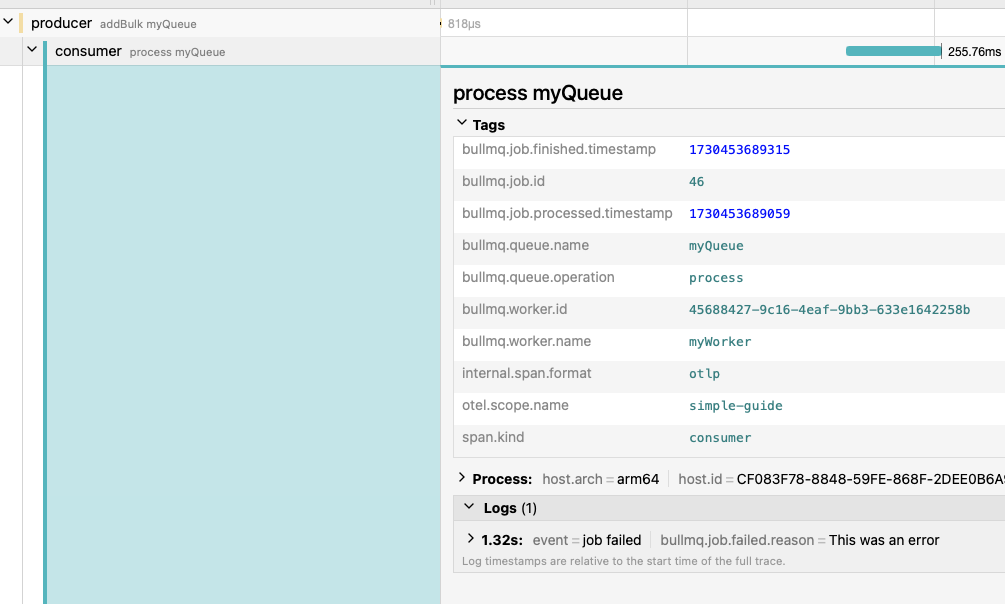
이 특정 작업과 관련된 유용한 태그들이 있고, span 수명 동안 발생한 이벤트를 보여주는 로그도 있습니다. 예를 들어 여기서는 작업이 주어진 에러 메시지와 함께 실패했다는 것을 볼 수 있습니다.
trace의 마지막 span으로 가보면, 마지막 재시도 전에 잠시 지연된 뒤 작업이 최종적으로 완료된 것을 확인할 수 있습니다: